
Using the Gantt Chart
Once you finished the setup and the configuration of the Gantt chart, you can start using it.
In a nutshell, the UI allows you to execute many tasks in a convenient way via shortcuts as well as to rollback changes prior to saving any results.
Saving changes
First, select your dataset and project. The view is set in such a way, that the complete scope of the project is shown, independent of the view preset that is configured for the datasource.
By default, when you make changes to the Gantt chart you need to explicitly SAVE them.
Quick action buttons
The Gantt Chart supports the following keyboard shortcuts (from left to right):
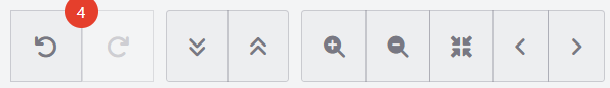
Undo last change
Redo last change
Expand hierarchy
Collapse hierarchy
Zoom in
Zoom out
Zoom-to-fit
Previous time span
Next time span
Editing an event
Doubleclick on an event to edit it.
In addition to general information about the event, you also get a list of predecessors, successors and the assigned resource.
Right-click on an event
Right click on an event to:
edit an event.
add a task, milestone or subtask.
convert the event to a milestone.
delete the event.
view the event.
Adding dependencies
If you have defined dependencies in the datasource, it is possible to add new dependencies via the UI by simply connecting the start and or end of events.
Customizing the look-and-feel
Many customizations are applicable across both the Gantt and resource based views:
Color coding of events: use color codes to make planning easier.
Use dynamic fields: use dynamic fields to customize which fields are shown for events.
In addition, there are some Gantt-specific customization parameters that are set in Custom Metadata Types.
Custom Metadata Types
There is currently one parameter for the Gantt chart:
Critical Path: Visualize the critical path in Gantt.